“We cannot afford to focus on UX, we are not even profitable”
This article was first published on Medium on Jan 21, 2021
Quite often, user satisfaction and business success are understood as opposite poles of the same axis. You either please your users by working on aesthetic functionalities, or you focus on business-driven initiatives. In too many planning sessions, the need to serve the user is overly expressed, as if there was a hidden fight for priorities: You either make money, or you make the users happy.

Photo by Diana Polekhina on Unsplash
How to measure User Experience to meet business goals.
If the sentence “We can not afford to focus on UX, we are not even profitable” sounds familiar to you, then there seems to be a fundamental misunderstanding of why businesses are successful: They build services people enjoy, keep using, and recommend to others.
Great user experience is the key foundation of long-lasting business success. UX and business go hand in hand. Still, too many UX professionals have to fight for a seat at the business table, and many won’t be invited. Why is that?
To be fair, UX professionals often speak a defensive and protective language towards business-driven initiatives that try to boost conversion and retention beyond organic levels. Also, the positive business impact of great UX is hard to measure. If you want to influence at top level, you can not just be an expert in end users, but you need to understand the business. You need to articulate the user needs as business opportunities. That is when UX gets a voice.
As a UX professional, you are an agent of change. You are the strange one, because you see the company through the eyes of the customers, while management looks at the company through the eyes of revenue and growth. Don’t expect that they connect with you. You need to connect to them. Articulate UX in the language of business. Explain how UX drives profit, revenue and differentiation. Overall, great UX leads to success.
How do you know you are doing well as a product? You are most certainly looking at a list of established indicators: Page views, Clicks, Uplift, Latency, Active Users, Revenue. The combination of these numbers create a story of success. These key metrics are established and well understood. And they are very good indicators for success. You must look at them. But they only show a fraction of what your users do in your product.
A user-centered approach to measuring performance
Business metrics alone can not explain user behavior well enough to shape future directions and make use of your potential. In addition to traditional business metrics, you should implement user-centered metrics for your product to serve company goals. In order to understand success and failure, you must understand what users do.
When business metrics are poorly chosen or optimized, it can lead to poor product decisions. I want to give you an example:

While the top line of active user metrics over time looks great and shows growth, but if you look closer, we see that we are not growing as fast as we could because we are losing existing users. So we do have something to do to keep these users from churning. So we must look into reasons why users are leaving the product and figure out if there are ways we can tackle that. While the top-line business metrics would not drive action, because everything looks good, well defined UX metrics can lead to a deeper investigation of user behavior and boost overall business performance.
UX metrics are defined based on underlying business criteria. You will need two key concepts for each activity to define UX metrics:
Goal: How do you want users to engage with your product/service?
Signal: What changes in user behavior or opinion would indicate goal success?
The goal defines how we expect users to behave in order to be successful as a business. As a second step, we define the signal that indicates that we are going well. These goals and signals must be defined for every new feature and product part. There is a famous framework originally introduced by Google, called HEART. It defines fives aspects of measuring UX:
Happiness = Users enjoy/delight in using your product
Engagement = Users interact deeply and broadly with your product
Adoption = Users discover and try your product
Retention = Users keep coming back to your product
Task success = Users can complete tasks effortlessly
You can define each of these five aspects as your goals for great UX. Now what you need to do is define signals that measure how you are doing. These could be survey results, ratio of purchase and refund, feature mentions in the store ratings, feature usage, time spent, session length including an activity, results of usability testings or other applicable measures.

Let us imagine we run an online shop for sunglasses and our UX team just finished a new feature that allows customers to virtually try on our products by using their webcam and face recognition technology (a virtual mirror). We have a live version A without the feature and a version B including the feature. Our goal is to show that the improved user experience will actually lead to business success. Unfortunately, as we can see on the revenue plot, the impact of the feature was not measurable and you could argue it was a waste of time, energy and effort. From a business perspective, we should have spent our resources differently, because the implementation did not make any difference. Your feature did not boost business performance.
But that is not the full picture. Together with User Research and Data professionals, you started implementing UX success metrics and you have additional information you can look into. Let’s look at the numbers.
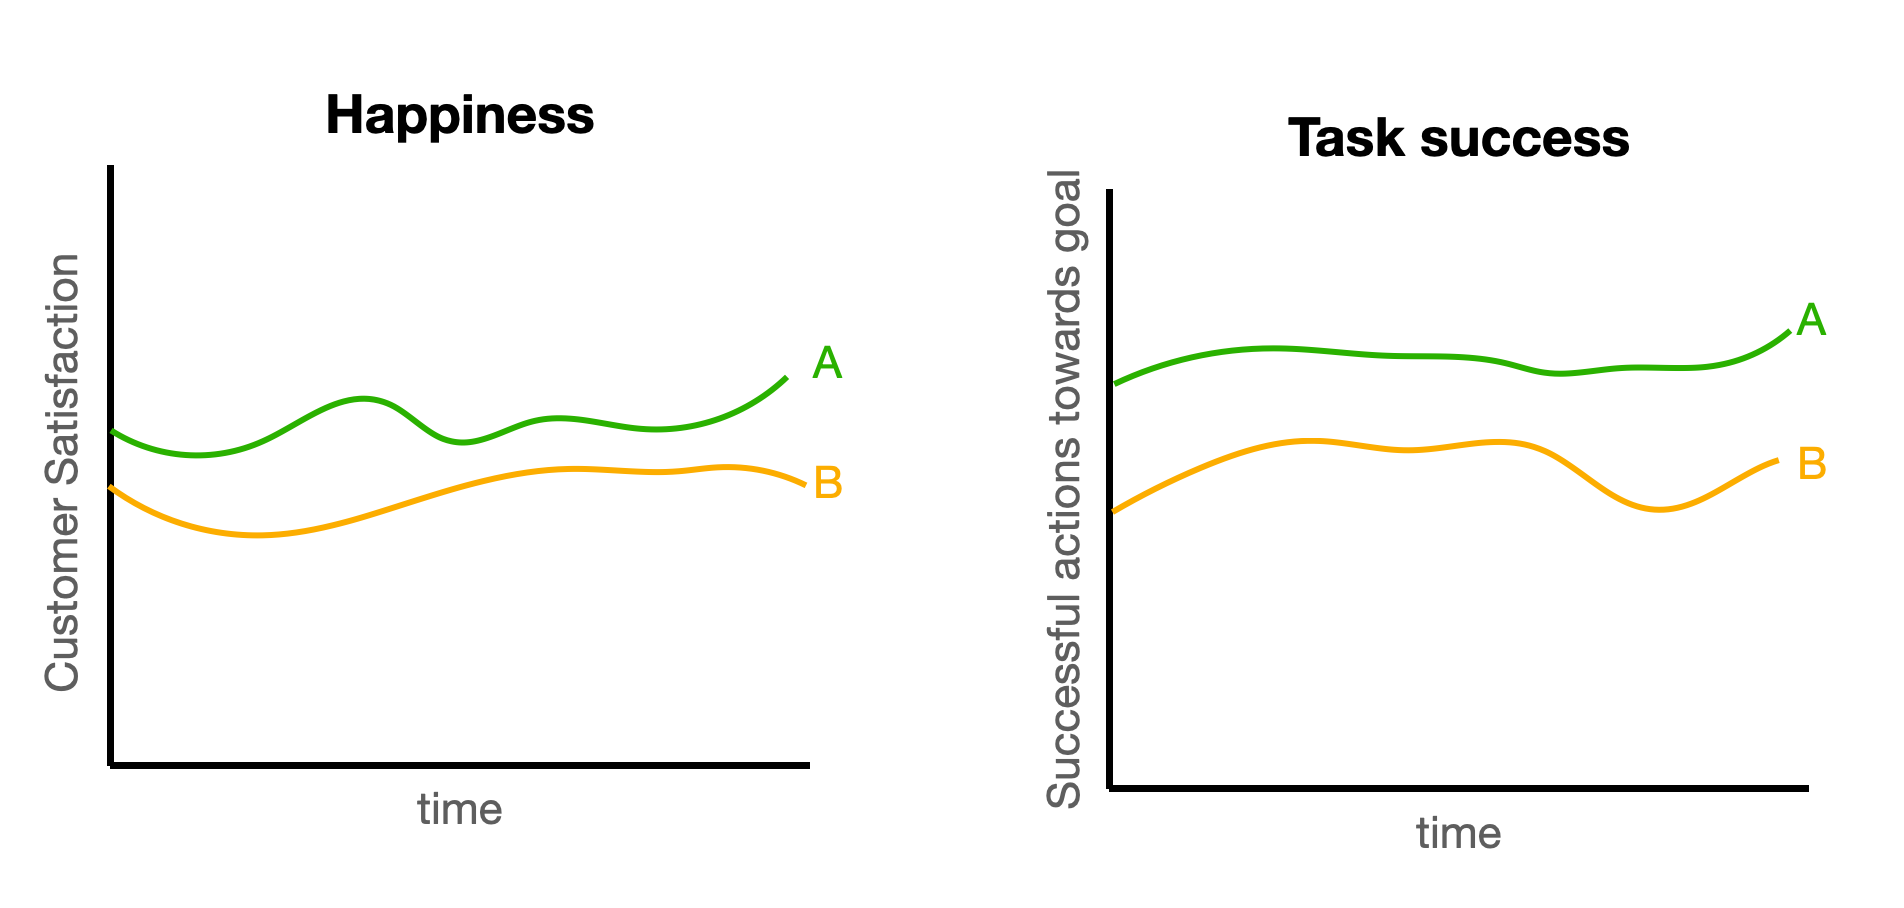
Happiness
Your goal is that customers enjoy using the website. Your signal is an NPS survey that is triggered whenever a person in on the website for more than 20 seconds. You can see that the happiness of your version B (including the digital mirror) was a lot lower. After a round of user interviews, you understood the reason: When a customer visited the landing page of the web shop, the browser immediately asked for permission to access the computer webcam, not only when the digital mirror would open later in the process. Customers had no idea why this website needed such sensitive access, declined and they were confused and unsatisfied. During feature implementation, you did not anticipate the effect it would have on users when an online shop requests access to the webcam. The measure of happiness during the A/B testing phase made it visible to you that something is wrong, giving you the opportunity to improve the situation and unlock further potential.
Task success
Your goal is that customers put a pair of sunglasses in their cart after trying them on in the digital mirror. Your signal is the share of completed checkouts per visitor. Also here you see that version B is a failure. Less people complete their purchases than on the website without the digital mirror. What you learned after the further investigation is whenever a customer selected a pair of glasses, the digital mirror would automatically open and often present a black screen (no permission to open the webcam), leading to further confusion, lower exploration, lower completion rate, and therefore fewer customers who completed the purchase.
Considering the flaws of the product, how can it be that version B still generated as much revenue as version A without the digital mirror? It turns out, the digital mirror was a massive revenue driver when users gave access to the webcam on the landing page. The feature was amazing. People loved it. In a user survey you learned that those who used the digital mirror said it gave them a lot more confidence in their purchase decision. They trusted the representation of their faces with the sunglasses so much that the average cart value significantly increased. The only problem was: Not enough people had a positive experience yet.
While you know this initial version of your feature did not boost overall revenue because it scared off too many people, you know what to do to unlock your feature potential. You measured your UX on different levels and you know how people behave within your product. If you manage to fix the issues you identified and improve the experience, you can be sure that revenue will increase thanks to the improvements in user experience. Becoming aware of unused potential is the essence of implementing UX success metrics.
Measure the negative funnel to unlock business potential
With the example above I wanted to illustrate the power of UX success metrics: They force you to deal with flaws and weaknesses. It makes them more obvious. A common way of measuring success is completion rate, adoption rate, retention rate, all of which are positive funnel metrics. You measure what share of customers does something. But to fully unlock your potential, you must not only understand how many people do something but also why the others don’t. Implementing UX success metrics forces you to deal with flaws in your funnel, issues in your products, unused potential in your implementation. It forces you to think about how the users behave, to look at data from different angles, to investigate issues you did not even consider. It gives you a more realistic measure of success, beyond the traditional business metrics. And when things go well, they allow you to link business success to improvements in UX. You will be able to show how incremental improvements in your experience can positively impact the top-line business metrics of your company.